Heap optimization means speed optimization
Find heap allocations and nail them down to save 0.67µs (37%) on a Raspberry Pi 3 in an inner loopHeap optimization
For hot code paths, it is important to reduce heap allocations. This reduces the GC pressure and it is generally a speed optimization at the same time. We’ll see real world examples below.
Reducing heap usage can be done in a few ways and I’ll show case three in this post:
- Favor concrete types over interfaces.
- Favor the stack when the object doesn’t escape.
- Contain objects inside other objects when the object escape.
This post completes with a read-world example which shaves off 0.67µs (37%) in an inner function in periph.io.
Concrete over Interface
The first point is easily shown by an example:
img := image.NewNRGBA(1, 1)
r, g, b, a := img.At(0, 0).RGBA()
// vs
r, g, b, a := img.NRGBAAt(0, 0).RGBA()
If you look at the source code, it looks fairly innocuous:
func (p *NRGBA) At(x, y int) color.Color {
    return p.NRGBAAt(x, y)
}

func (p *NRGBA) NRGBAAt(x, y int) color.NRGBA {
    if !(Point{x, y}.In(p.Rect)) {
        return color.NRGBA{}
    }
    i := p.PixOffset(x, y)
    return color.NRGBA{p.Pix[i+0], p.Pix[i+1], p.Pix[i+2], p.Pix[i+3]}
}
Especially when you look at color.NRGA definition:
type NRGBA struct {
    R, G, B, A uint8
}
The challenge is that color.Color is an interface, so even if NRGBAAt() returns a concrete type, At() must allocate on the heap to return an interface object.
There’s a subtle case in the apa102 driver of periph.io.
The recommendation is to favor returning concrete types instead of interfaces whenever possible.
Stack over heap
Unlike some popular languages, Go permits using the stack extensively and the runtime doesn’t enforce a predefined stack size limit. Using the stack for short lived objects reduces the allocation of small objects on the heap.
For slices with known size, a simple trick can be:
n := 16
...
b := make([]byte, n)
// vs
b := [16]byte{}
The main difference is that at utilization, you’ll need to specify b[:] to
create a slice referring to the
array.
Edit: As Roger
Peppe noted, the
compiler may silently optimize trivial statements like b := make([]byte, 16)
into b := [16]byte{} so it is not recommended to do a wholesale replacement
unless visible improvements can be measured.
Sometimes, it can be as simple as:
f := &foo{ ... }
// vs
f := foo{ ... }
In doubt, profile as explained at the end of this post.
Containment
In some case, a function needs a temporary object or a slice that has definite lifetime but unknown size. Or it could be that the escape analysis determines that the object needs to be on the heap.
See further reading below for more information about escape analysis.
In these cases, it can be useful to put a cache of the object in a large object, especially when the function is a hot spot. This can be as simple as:
type obj struct {
  scratch [16]byte
}

func (o* obj) doStuff(l int) {
  var b []byte
  if l < len(o.scratch) {
    b = o.scatch[:l]
  } else {
    b = make([]byte, l)
  }
  // Use b
}
This optimization is great for for functions called often but not concurrently. Preallocate a common array size and fallback to heap allocation only when necessary. A great example in the standard library is bytes.Buffer.bootstrap.
For functions that are called concurrently, sync.Pool can be leveraged to attain similar heap reduction improvements.
Improvement in practice
Here’s a real world example of these optimizations.
To make an I/O operation on the SPI bus on a Raspberry PI, the sysfs SPI code in periph.io had to allocate temporary objects when converting a Tx() call into the underlying expected format. This is an important part as I/O can be done at a fairly high rate, so I decided to take a deeper look.
go get -u periph.io/x/periph
cd $GOPATH/src/periph.io/x/periph

# Checkout just before the optimization:
git checkout 08925ec22a069ab0c3cdb1a7bc00f5594e81ba0f~1

go test -cpu=1 -bench=. ./host/sysfs
# Intel Xeon
BenchmarkSPI    10000000      167 ns/op     32 B/op     1 allocs/op
# Raspberry Pi 3
BenchmarkSPI     1000000     1795 ns/op     32 B/op     1 allocs/op
While the performance isn’t horrendous, it is not great for a benchmark that does essentially nothing.
Applying containment principle, the commit including the optimization does three things:
- Contain
spiConninsideSPI, removing one unnecessary heap allocation. - Preallocate an array of 4
spiIOCTransferinstead of allocating one on the heap, contained insideSPI. - In
txInternal(), use an item from this array instead of trying to allocate on the stack, which the compiler promoted to the heap anyway, to effectively get around the escape analysis issue inIoctl()call.
This results in the following diff:

And with, this change, the benchmark improved a lot:
# With the optimization:
git checkout 08925ec22a069ab0c3cdb1a7bc00f5594e81ba0f

go test -cpu=1 -bench=. ./host/sysfs
# Intel Xeon
BenchmarkSPI    20000000     68.0 ns/op      0 B/op     0 allocs/op
# Raspberry Pi 3
BenchmarkSPI     1000000     1125 ns/op      0 B/op     0 allocs/op
In addition to the GC churn reduction, that’s a 60% performance increase on Intel and 37% on a Raspberry Pi 3!
Analysis
But how did I figure out? Via a memory profile!
While it may be initially daunting, it is not as frightening as it looks like. Here’s a step-by-step guide to reproduce the memory profile.
- First, upgrade to a recent go version. At the time of writing, Go 1.10.2 is the current release.
- Get the most recent version of pprof.
While a snapshot of the tool is available in the toolchain as
go tool pprof, there’s no reason for not using the latest version:go get -u github.com/google/pprof - Write a micro benchmark covering the code you want to optimize like this one. Beware of what the microbenchmark tests for. The Go’s optimizing compiler can optimize your code paths if they are too trivial, and optimization will differ across CPU architecture (ARM vs x86).
- Build it. This is to enable source annotation:
go test -c - Run your newly compiled executable. Using a short benchtime accelerates the
process:
./foo.test -test.bench=. -test.benchtime=10ms -test.memprofile=mem.out -test.memprofilerate=1 - Start the web server, telling
pprofto show all allocations ever done:pprof -http=:6061 -sample_index=alloc_objects mem.out - Visit http://localhost:6061 with your web browser. You should see something
like this:

Screenshot of pprof web UI. - Click
txInternalfunction box. - Click
VIEWmenu at the top. - Select
Source. You should be presented with this screen:
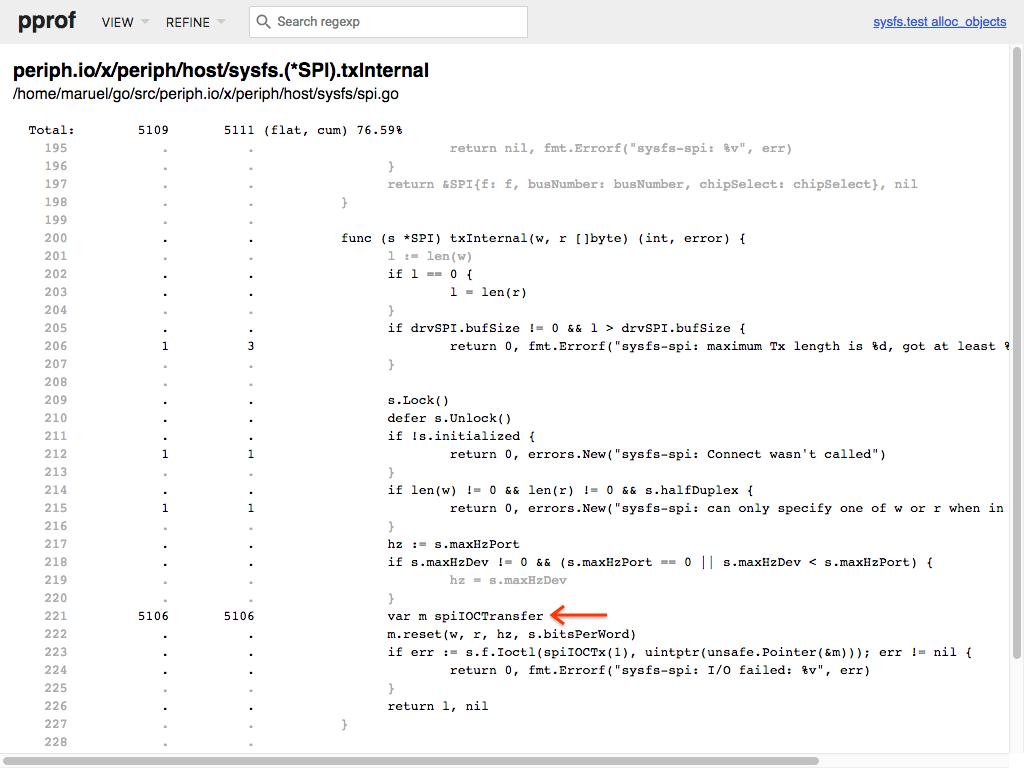
Screenshot of pprof web UI view of source. - You got the culprit! Don’t be fooled by it’s innocuous look, it’s a heap
allocation! This is because of the compiler escape analysis of
Ioctl()at line 223, the compiler doesn’t know what the function will do with the unsafe pointer. - Now try to find a way to make the code not allocate, then iterate until you zapped all allocations you found that are worth fixing.
One word of caution
Before optimizing a loop, make sure it’s actually a hot code path. This can be asserted via profiling, provided by the runtime/pprof package. Also beware of microbenchmarks, which can occasionally lie and turn you into a rabbit hole optimizing unimportant things.
If you care about performance on a Raspberry Pi or on ARM in general, run the benchmarks there. The Go compiler optimizations and CPU performance characteristics are wildly different.
Still, putting objects on the stack is generally a safe bet.
More reading
I hope you enjoyed this post! Here’s further reading by excellent people:
- Julia Evans’s great overview of pprof.
- JBD’s post about pprof new UI, check out the web site archives for more posts.
- Dmitry Vyukov’s excellent guide to help write memory efficient software.
- William Kennedy’s post about Go escape analysis as part of a 4 posts series about how language mechanics affect memory layout.
- Dave Cheney’s post Go’s hidden
pragmas which covers
all Go’s pragmas, including
//go:noescapewhich can be used for escape analysis improvement when interacting with C code.